


Vietnam: Vietnam Economy Profile
2015/02/19

BASIC INFORMATION
Capital: Hanoi
Surface Area: 331,210 sq km
Head of State: President Truong Tan Sang
Head of Government: Prime Minister Nguyen Tan Dung
Official Language: Vietnamese
Currency: Vietnamese dong (VND)
Population: 89,693,000 (2013 estimate)
GROSS DOMESTIC PRODUCTION (GDP)
Vietnam’s nominal GDP reached US$171.4 billion in 2013, while GDP per capita reached US$1,911 in the same year. Economic growth in 2013 was 5.4%, slightly higher than in 2012 with 5.2%. In the years leading up to the global financial crisis, Vietnam had high economic growth of over 7% per year but growth declined to 5.7% in 2008 and 5.4% in 2009. Economic growth started showing signs of recovering in 2010 and 2011, reaching 6.4% and 6.2% respectively, but deteriorated after that. A likely reason for the slower growth is Vietnam’s impressive macroeconomic stabilisation and reduction of inflation from over 18.7% in 2011 to below 6.6% in 2014.
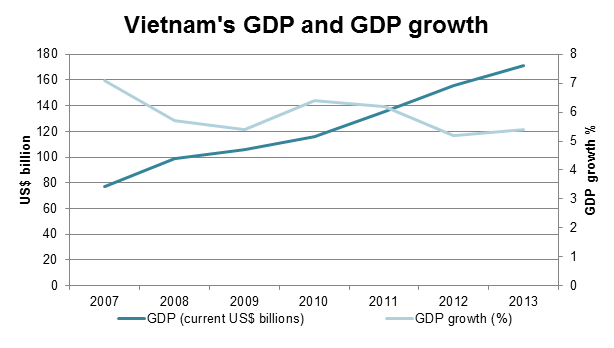
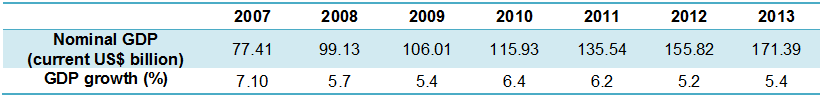
Source: World Bank
GDP components
Household consumption accounted for about 63% of Vietnam’s GDP in 2012, or US$100.5 billion. Government consumption totalled US$9.24 billion which was 6% of GDP, while investment amounted to US$42.45 billion and accounted for 27% of GDP. Vietnam’s external trade balance was positive in 2012 for the first time in decades with US$5.46 billion, about 3% of GDP.
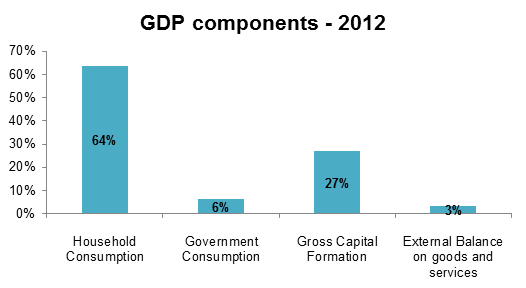
Source: The World Bank
GDP Composition
Industry and construction had traditionally been the largest contributor to GDP but the services sector has grown very fast in the past few years and is now the largest sector in Vietnam. Services accounted for 42% of GDP in 2012, while Industry accounted for 38%. Industry includes mining, manufacturing, construction, electricity, water, and gas but manufacturing is by far the largest sub-sector and contributed in 2012 about 17% of GDP. Agriculture, including forestry and fishing, accounted for 20% of GDP in 2012.
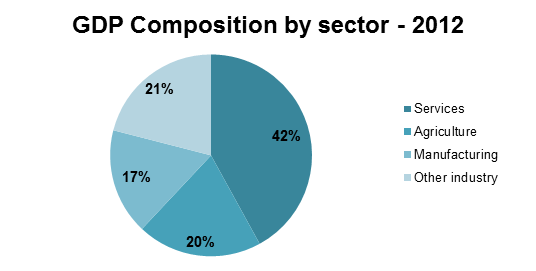
Source: The World Bank
![]()
CURRENCY
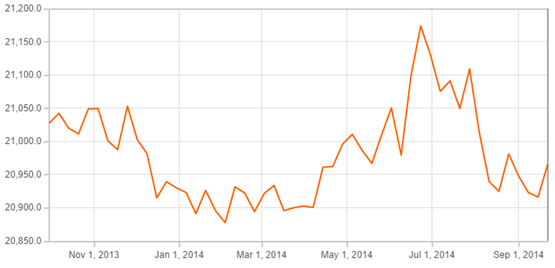
The currency of Vietnam is the Vietnamese dong and its ISO currency code is VND. The exchange rate of the Vietnamese dong has been relatively stable for the past year, around 21,000 dong per US dollar. The average bid rate for the first three quarters of 2014 was 20,942 and the average ask rate was 21,509.
Official Exchange Rate
VND per USD – 1 year
The State Bank of Vietnam devalued the dong in June 2013 for the first time since 2011, and set a reference rate by 1% to 21,036 dong per US dollar.[1] Vietnam’s central bank depreciated the Vietnamese dong by 8.5% in February 2011 in an attempt to curb the trade deficit and narrow the gap between official and black market exchange-rates.[2] The depreciation contributed to the extremely high inflation rate of 18.7% in 2011. The exchange rate has been more stable since then, albeit at higher rates.
Official Exchange Rate
VND per USD – 5 year
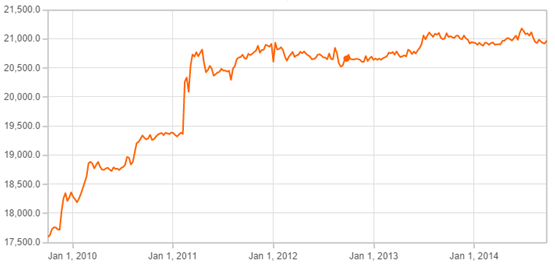
Source: OANDA
TRADE
Intra- and extra-ASEAN trade in 2013
Vietnam’s total trade in 2013 was US$264.78 billion, with exports of US$132.67 billion and imports of US$132.11 billion. Intra-ASEAN trade reached US$39.53 billion in 2013, accounting for 14.9% of Vietnam’s total trade. The share of intra-ASEAN exports of total exports was 13.7% and the share of intra-ASEAN imports of total imports was 16.2% in 2013.
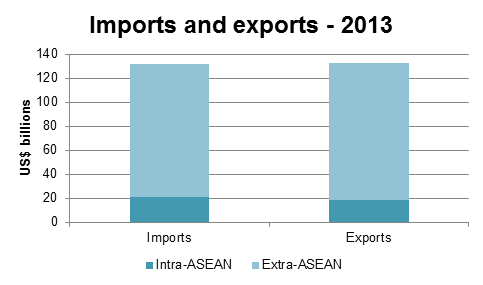
Vietnam’s intra- and extra- ASEAN exports and imports, 2013
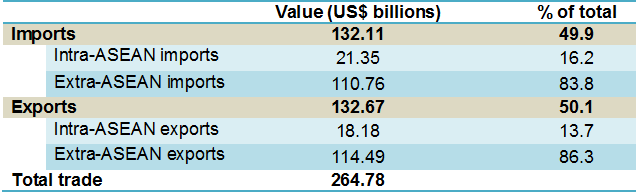
Source: ASEAN Secretariat
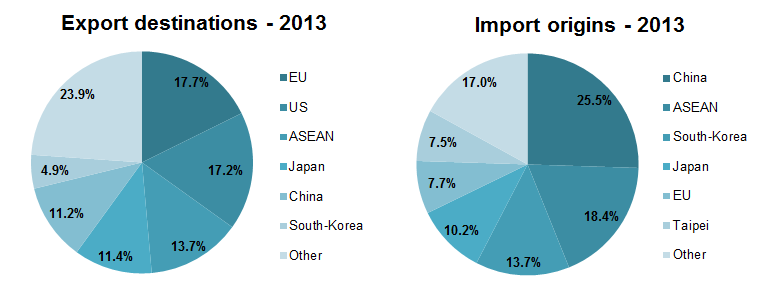
Trade partners
Vietnam’s largest export destination in 2013 was the European Union (17.7%), followed by the US (17.2%) and ASEAN (13.7%). Japan and China received about 11% of Vietnam’s exports each and South-Korea about 5%, that same year. Almost 24% of total exports in 2013 went to the rest of the world.
Vietnam mainly imports manufactured goods from Asia. China is Vietnam’s top import partner, accounting for 25.5% of Vietnam’s total imports in 2013. ASEAN countries accounted for 18.4% of total imports, while South Korea, Japan, the EU and Chinese Taipei accounted for 13.7%, 10.2%, 7.7% and 7.5%, respectively. The remaining 17% of imports in 2013 came from the rest of the world.
Source: The World Trade Organisation
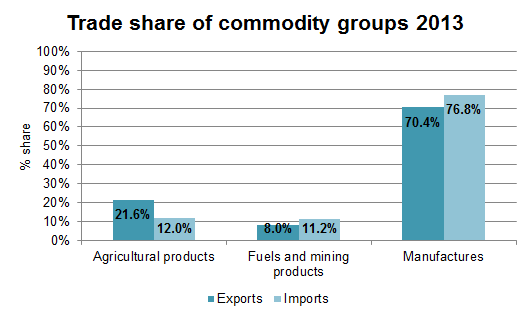
Commodity groups
The largest share of both Vietnam’s exports and imports are manufactured good with 70.4% share of all exports and 76.8% of all imports. The second largest exported commodity group is agricultural products (21.6%) and lastly fuels and mining products (8%). About 11.2% of Vietnam’s imports in 2013 were fuels and mining products, while about 12% were agricultural products.
Source: The World Trade Organisation
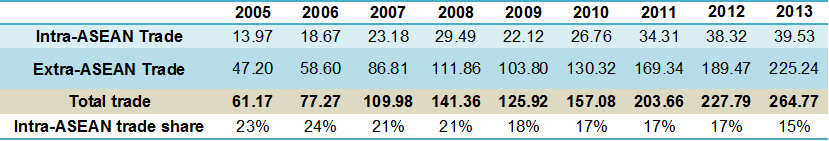
Intra- and extra-ASEAN trade 2005-2013
Vietnam’s trade with the world has increased substantially over the past decade, and the country’s total trade in 2013 was more than quadrupled the 2005 level. Vietnam’s average annual export growth was 20% between 2005 and 2012 and the average annual import growth was 18% during the same period. Vietnam’s trade took a hit following the global financial crisis and Vietnam’s exports in 2009 were only US$56.69 billion, compared with US$61.77 the year before.
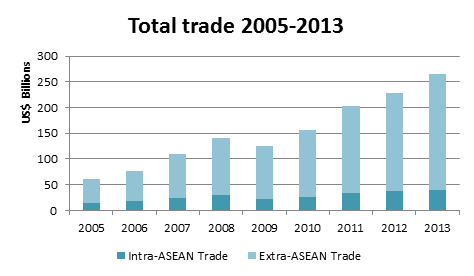
Extra-ASEAN trade has grown faster than intra-ASEAN trade over the past few years. The share of intra-ASEAN trade has fallen from 24.2% in 2006 to 15% in 2013.
Vietnam’s intra-, extra- and total trade 2005-2013 (US$ billions)
Source: ASEANstats
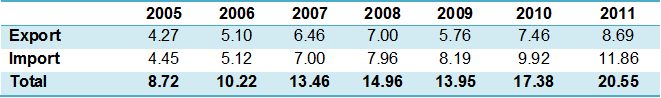
Trade in services 2005-2012
Vietnam’s trade in services has followed the same trend as the goods trade, with a steady increase over time but with a small setback in 2009. Vietnam’s total trade in services reached US$20.55 billion in 2011, with US$8.69 billion of imported services and US$11.86 of exported services.
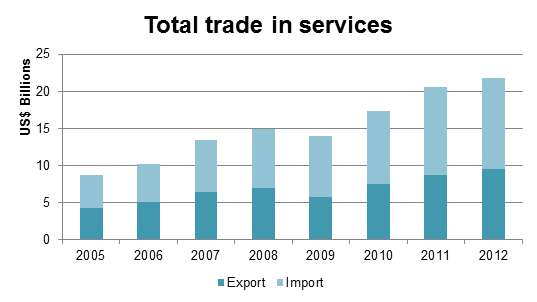
Trade in services 2005-2011 (US$ billions)
Source: ASEAN Statistics
FOREIGN DIRECT INVESTMENT (FDI)
Vietnam’s total FDI inflow increased substantially in the years before the global financial crisis and reached a peak in 2008 with total FDI of US$9.58 billion. Total FDI inflow reached US$8.90 billion in 2013 with the largest sectors drawing FDI being industry and construction, oil and gas, agriculture, transportation, communications, and the hospitality sector.
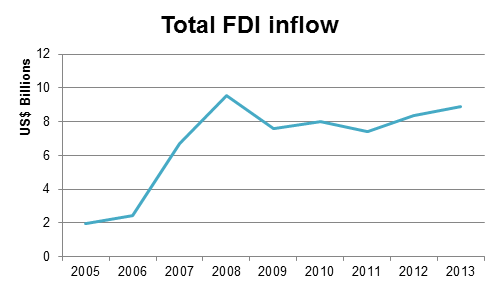
FDI net inflows 2005-2013 (US$ billions)

Source: Worldbank
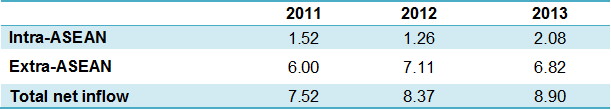
The largest part of Vietnam’s FDI inflows is from countries outside of ASEAN. In 2013, extra-ASEAN investments accounted for US$6.82 billion while intra-ASEAN investments accounted for US$2.08 billion.
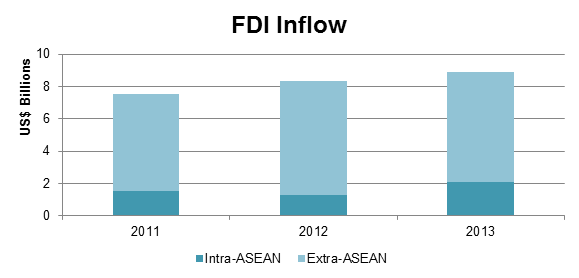
FDI net inflow, intra- and extra-ASEAN, 2011-2013 (US$ millions)
Source: ASEAN Secretariat

- Vietnam News
-
- AFGHANISTAN: UNWTO: International tourism – strongest half-year results since 2010
- UNITED STATES: Vietnam to pull the US back to Asia?
- VIETNAM: Startups in Vietnam
- BRUNEI : The next chapter for the Trans-Pacific Partnership
- VIETNAM: Vietnam’s Left-Behind Urban Migrants
- CHINA: Vietnam's imports of pesticide rise 7.5 pct in Q1, mostly from China

- Trending Articles
-
- CHINA: China welcomes Guinea to take part in Belt and Road Initiative
- CAMEROON: Poor End of Year Results for Cameroon Students
- AUSTRALIA: Queensland Bauxite Gains State Approval of Mineral Development Work Program
- CHINA: Chinese-supported infrastructure projects change Zambia's landscape
- UNITED STATES: Spotify, Hulu target students with discounted bundle
- UGANDA: Ugandan Govt Starts Verifying International Academy Teachers


