


Armenia: Armenia Energy Profile
2011/01/22

Nuclear Power in Armenia
Even though Armenia has only one operating nuclear reactor, this unit supplied 39.4% of the total electricity produced in 2008 – 2.27 billion kWh net. Of the 5.9 billion kWh gross generation in 2007, nuclear supplied 43%, hydro 31% and gas 25%. Electricity consumption per capita is about 1700 kWh/yr. Natural gas, which is imported from Russia, is its main source of primary energy.
In 2003, Armenia turned over financial control of Metsamor to Russia's state-owned power monopoly, Unified Energy Systems, in accordance with a swap agreement that settled the plant's $40 million debt to Russian nuclear fuel suppliers.
1. Overview of Electricity Supply
 Electricity is currently generated through thermal, hydroelectric, and nuclear resources, with no significant generation from non-hydro renewable energy sources.
Reform of the energy sector is now under way. The sector has required increasing levels of government support, and is suffering from severe underinvestment. Restructuring to upgrade the system, promote commercialization and increase competition is imperative. The priorities are to address system malfunctions and invest in maintenance of circuits and equipment as well as technology replacement.
In line with these reforms,
|
Demographical Information |
|
|
Population, millions (2009) |
2.97 |
|
Land area, thousand sq km (2009) |
29.74 |
|
Macroeconomic Information (2008) |
|
|
GDP, billion |
18.9 |
|
Real GDP growth rate, percent |
7.6 |
|
Foreign direct investment (net), million US$ (2007) |
658 |
|
Electricity disposition, billion kWh (2006) |
|
|
Generation |
5.54 |
|
Consumption |
4.54 |
|
Exports |
0.32 |
|
Imports |
0.40 |
|
Generation capacity, GW (2005) |
|
|
Nuclear |
0.37 |
|
Thermal |
1.78 |
|
Hydro |
1.05 |
|
Other renewables |
0.00 |
|
Total |
3.20 |
|
Sources: CIA World |
|
A near majority of
In addition to the nuclear plant,
Hydroelectricity provides a significant portion of
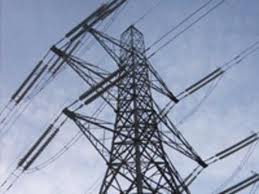
The electric supply is currently not available to all regions on a regular basis, thus potential demand far outpaces supply. The national transmission grid can be seen on the map below.
Electricity Transmission Grid of
![]()
The chart below shows the goals for small and medium hydropower and wind power capacities.
Diversification Strategy Projection

The “Energy Law,” adopted in April 2001, ensures the obligatory purchasing of renewable energy with higher than average electricity tariffs during the 15 years after the commissioning of the plants. As of January 2009, the announced feed in tariff is approximately 0.09 USD/kWh (31.343 AMD/KWh) without value added tax. Some of the basic principles of the policy are as follows
· Enhancement of competition and efficient operation in the energy sector.
· Regulation on energy sector operations.
· Protection and balance of interests between consumers and economic entities.
· Efficient use of domestic and alternative sources of energy, and the creation of economic and legal mechanisms to serve that purpose.
· Encouragement of investments, safety and environmental protection in the energy sector.
· Separation of the generation, transmission, and distribution system operator.
On November 9, 2004 legislation was passed on the Law of the
· Strengthening the economic and energy independence of the
· Increasing the economic and energy security; and energy systems safety level of the
· Establishing and developing new industry infrastructure and organization of services promoting energy saving and renewable energy;
· Reducing adverse techno-born impacts on the environment and human health.
The principles of state policy in the area of energy saving and renewable energy are:
· Increasing level of supply of indigenous renewable energy carriers to satisfy the energy demand of the economy;
· Implementing energy saving, as well as development and enforcement of legal and economic mechanisms for the promotion of renewable energy;
· Ensuring high priority of efficient use of energy given the increasing volumes of imported and extracted energy resources;
· Ensuring increase of renewable energy resources usage as well as application and development of renewable energy new technologies aimed promoting that;
· Ensuring competitiveness of renewable energy resources and protection/enforcement of rights of businesses engaged in the area of renewable energy;
· Ensuring high priority of issues of environmental protection and efficient (economic) usage of natural resources while implementing measures/activities aimed at the development of the energy saving and renewable energy;
· Promotion of energy efficient production of electric and/or heat energy, including for autonomous energy producers;
· Promotion of integrated activities between the autonomous energy producers, using renewable energy resources, and the energy system aimed at the exchange of electric energy;
· Promotion of consumer choices and use of different energy carriers and energy efficiency technologies;
· Implementation of energy saving and renewable energy state (national) targeted programs.
3. Wind
As a result of the regional and local winds, the wind resource distribution in

In recent years,
|
Site or Land Area |
Installed Capacity (MW) |
Annual Average Production (GWh) |
|
|
19.5 |
48.9 |
|
|
125 |
320 |
|
|
50 |
120 |
|
Total |
195 |
490 |
Wind monitoring for the following areas is not complete; however, from initial monitoring measurements, the following wind sites have been estimated.
|
Site or Land Area |
Installed Capacity (MW) |
Annual Average Production (GWh) |
|
|
155 |
420-430 |
|
|
125 |
300-320 |
|
Charentsavan Region |
20 |
45 |
|
Total |
300 |
765 |
The monitoring information about
Lori 1 Location within


Biomass energy in
Biogas is not currently utilized as a modern energy resource in
In 1994 The Armenian Ministry of energy articulated a strategy to “Develop and demonstrate a set of improved farm scale biogas concepts”. Under this program, The Armenian State Engineering University, the
The table below shows the overall biomass resource data for
|
Biomass resource type |
Total production |
Production density |
|
Total land area covered by |
(avg. 2006-2007, km2) |
(avg. 2006-2007, %) |
|
|
4,040 |
14 |
|
Permanent Crops |
525 |
2 |
|
Permanent Meadows and Pastures |
11,550 |
39 |
|
|
2,764 |
9 |
|
Other Land |
9,321 |
31 |
|
Inland Water |
1,540 |
5 |
|
Primary crop production |
(avg. 2006-2007, tonne) |
(tonne /100 km2) |
|
Total primary crops (rank among COO) |
2,062,857 (7) |
6,936.3 (18) |
|
Top 10 primary crops |
|
|
|
Potatoes |
539,738 |
1,815 |
|
Tomatoes |
264,000 |
888 |
|
Grapes |
200,686 |
675 |
|
Vegetables fresh nes |
169,000 |
568 |
|
Wheat |
149,850 |
504 |
|
Watermelons |
132,468 |
445 |
|
Cabbages and other brassicas |
112,500 |
378 |
|
Apples |
76,000 |
256 |
|
Cucumbers and gherkins |
75,500 |
254 |
|
Barley |
72,750 |
245 |
|
Animal units, number |
(avg. 2006-2007, number) |
(number / 100 km2) |
|
Cattle |
606,134 |
2,038 |
|
Poultry |
4,527,500 |
15,224 |
|
Pigs |
145,154 |
488 |
|
Equivalent animal units |
709,470 |
2,386 |
|
Annual roundwood production |
(2006-2007, m3) |
(m3 / 100 km2) |
|
Total |
61,145 |
206 |
|
Fuel |
51,000 |
171 |
|
Industrial |
5,000 |
16.8 |
|
Wood-based panels |
8,085 |
27.1 |
|
|
(2006-2007, tonne) |
(tonne / 100 km2) |
|
Paper and paperboard |
19,073 |
64.1 |
|
Recovered paper |
0 |
0 |
|
Source: Food and Agriculture Organization of the United Nations |
||
Approximately, 2.26 million m3 of solid municipal waste is annually generated in
To utilize biomass as an energy resource in
|
Meteorological Station |
Duration of Sunshine |
Avg. Daily Duration of Sunshine |
Cloudy Days |
|||
|
Measurements |
Theoretical Maximum |
|||||
|
hours/year |
% of year |
hours/year |
% of year |
hours/day |
days/year |
|
|
Martuni |
2689 |
30.7 |
4137 |
47 |
7.7 |
16 |
|
|
2629 |
30 |
4045 |
46 |
7.5 |
16 |
|
|
2599 |
29.7 |
4061 |
46 |
7.9 |
37 |
|
Kocbek |
2515 |
28.7 |
4192 |
48 |
7.6 |
36 |
|
Gumri |
2499 |
28.5 |
4165 |
48 |
7.5 |
35 |
|
Megri |
2377 |
27.1 |
3496 |
40 |
7 |
26 |
|
Dilijan |
2031 |
23.2 |
3627 |
41 |
6.3 |
42 |
|
Tashir |
2016 |
23 |
4114 |
47 |
6.3 |
43 |
|
|
|
|
|
|
|
|
|
Average |
2419.375 |
27.6125 |
3979.625 |
45.375 |
7.225 |
31.375 |
|
Maximum |
2689 |
30.7 |
4192 |
48 |
7.9 |
43 |
|
Minimum |
2016 |
23 |
3496 |
40 |
6 |
16 |
Solar Data for Several Meteorological Stations throughout
The table shows that the Martuni meteorological station has the largest measured amount of sunshine per year, while the
In spite of very favorable climatic conditions and absence of traditional energy resources, there is little use of solar energy in
|
|
|
Sevan |
Kochbek |
|
Jan |
200 |
281 |
311 |
|
Feb |
267 |
357 |
392 |
|
Mar |
417 |
518 |
537 |
|
Apr |
540 |
545 |
573 |
|
May |
720 |
666 |
654 |
|
Jun |
821 |
768 |
764 |
|
Jul |
858 |
825 |
817 |
|
Aug |
754 |
743 |
743 |
|
Sep |
594 |
580 |
589 |
|
Oct |
428 |
435 |
445 |
|
Nov |
251 |
285 |
299 |
|
Dec |
171 |
234 |
272 |
|
Yearly |
6021 |
6237 |
6396 |
Monthly and annual total solar radiation incident on horizontal surface, MJ/m2
|
|
|
Sevan |
Kochbek |
|
Jan |
178 |
387 |
391 |
|
Feb |
243 |
386 |
384 |
|
Mar |
364 |
441 |
408 |
|
Apr |
450 |
442 |
409 |
|
May |
667 |
565 |
534 |
|
Jun |
826 |
734 |
749 |
|
Jul |
861 |
774 |
848 |
|
Aug |
810 |
775 |
804 |
|
Sep |
740 |
704 |
743 |
|
Oct |
534 |
587 |
616 |
|
Nov |
312 |
440 |
461 |
|
Dec |
175 |
373 |
373 |
|
Yearly |
6160 |
6599 |
6720 |
Monthly and annual direct solar radiation incident on surface normal to sunlight beams, MJ/m2
The solar resource maps below illustrate the direct normal and global horizontal irradiation throughout
Direct Normal Irradiation for

Global Horizontal Irradiation for

Several private companies in
Armenian law provides that purchasing of all the electrical energy from renewable energy sources is mandatory during the first 15 years after commissioning. As of January 2009, the announced feed in tariff is approximately 0.09 USD/kWh (31.343 AMD/KWh) without value added tax.
The underground reservoirs containing the thermal water were formed both in the porous alluvial sedimentary rocks of intermountain basins and in fissured crystalline rocks. A narrow zone in the central part of
Geothermal reservoirs in porous rocks containing high-temperature thermal water were investigated in some places:
– Inflows of thermal water with temperature of 110 °C were obtained in the upper cretaceous sediments in wells with a depth of 2.5 km (Bajandur, Dilidjan, Vanadzor);
- Temperatures of thermal water of 100 °C were recorded at a depth of 2.6 km in the upper cretaceous sediments of Ararat basin (Razdan). It is projected that at a depth of 3.6 km the temperature might be up to 160 °C.
Considerable inflows of low-temperature thermal water were obtained in two regions:
- Martouni: prospecting wells with a depth of 1200 m investigated the reservoirs with the thermal water. Its temperature is 32-40 °C, mineralization 2-3 g/l, inflows- 2-50 l/s. The total thermal capacity is estimated as 8 MWt;
- Sisian: prospecting wells investigated the adjoining hydrothermal system, where the temperature of thermal water is 36-43 °C, its mineralization 4-6 g/l, the inflows 20-100 l/s. The total thermal capacity is estimated as 8 MWt.
Past and present information regarding geothermal energy in
Map of Potential Geothermal Site in

From these sixteen zones, the highest temperatures were recorded for the Jermouk zone (63 °C). More than 30 wells have been drilled near the city of
The EuropeAid Project, “Support to the Energy Policy of Armenia,” identified three zones with potential for a pilot project for geothermal energy utilization. The three zones are Gridzor-Noradus, Martuni-Armghan, and Karchakhpyur-Porak.
The Gridzor-Noradus and Martuni-Armaghan zones are the most studied potential sites; they could potentially be from the same geothermal system. The springs are located near the towns of Gavar and Martuni, so infrastructure could be available for geothermal energy consumption. The average temperature of these sites has not been concluded, but it is believed that the temperatures do not exceed 100 °C.
The Karchakhpyur-Porak zone is less studied, but it could proven to have better resource. Temperatures between 42-49 °C at depths of 550-750 m have been measured at the center of the zone. This zone encompasses Jermouk, the site listed as having the highest temperature in the study above (Renewable Energy
The only definite opportunity for geothermal development in
The hydro potential of
Considering that the electricity production has been about 5.5 billion kWh during the last few years, utilization of hydro potential would satisfy 50 per cent of the current demand and not only avoid an energy crisis but also contribute to the development of the economy and increase the stability of improvements.
Currently, the total installed capacity of hydropower plants is approximately 1000 MW. The privately-owned Sevan-Hrazdan HPP Cascade has an installed capacity of 405.46 MW while the state-owned Vorotan HPP Cascade totals 556.3 MW.
Given the adoption of the “Energy Sector Development Strategies in the Context of Economic Development in
Potential hydro resources of
In estimation of total hydropower potential of

- Armenia News
-
- AFGHANISTAN: The newly created Eurasian Economic Union (EEU) has shortly got the momentum
- ARMENIA: 2015 Euro-Asia Economic Forum in Xi'an,
- ARMENIA: EU-funded project: round table on ethics and disciplinary issues in Georgian Bar Association
- ALBANIA: TAP starts construction of access roads, bridges in Albania
- AFGHANISTAN: Revised IMF forecasts signal gloom on global economic outlook
- AFGHANISTAN: Oxfam Study Finds Richest 1% Is Likely to Control Half of Global Wealth by 2016

- Trending Articles
-
- FRANCE: Cavendish doing it for Africa
- CONGO BRAZZAVILLE: Congo: Total abandons oil field citing decrease in global oil prices
- SOUTH AFRICA: South Africa’s Biggest Labor Group to Balance Pay With Job Security
- EUROPEAN UNION: EU meets without Britain for first time since Brexit vote
- NIGERIA: Lagos hosts 2016 Africa fashion week Nigeria
- KENYA: Nairobi to host 14th UN conference on trade and development


