
Philippines: Philippines Economy Profile
2015/02/16

![]()
BASIC INFORMATION
Capital: Manila
Surface Area: 300,000 sq km
Head of State: President Benigno Aquino III
Official Language: Filipino
Currency: Peso
Population: 98,390,000 (2013)
![]()
GROSS DOMESTIC PRODUCTION (GDP)
The Philippines, one of ASEAN’s fastest growing economies, had GDP growth of 7.20% in 2013. Economic growth was hard hit by the global financial crisis, with growth in 2009 being only 1.1%, but made a remarkable recovery and reached 7.6% economic growth in 2010. Nominal GDP reached US$272.032 billion in 2013 and GDP per capita was US$2,765.

Philippines’ GDP and GDP growth 2007-2013
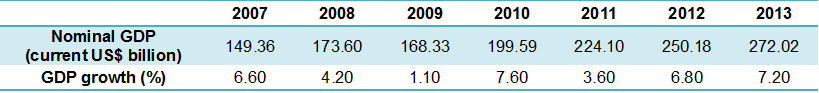
Source: World Bank
GDP components
The by far largest component of the Philippines GDP is household consumption which totalled US$199.4 billion, accounting for 73% of GDP in 2013. Government consumption totalled US$30.2 billion which was 11% of GDP, while investment amounted to US$53.5 billion, accounting for 20% of GDP. The Philippines had a trade deficit of about US$11 billion in 2013.

Source: The World Bank
GDP Composition
The services sector accounted for 57% of Philippines’ GDP in 2012, while agriculture, including forestry and fishing, accounted for 12% of GDP. Manufacturing provided 21% of GDP and other industries provided 10% of the Philippines GDP in 2012.

Source: The World Bank
CURRENCY
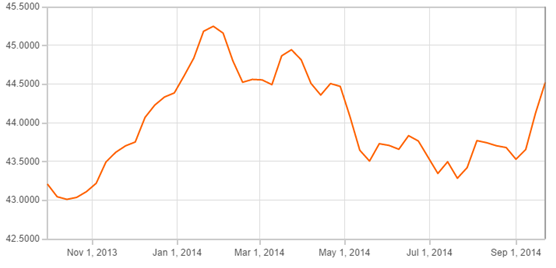
The Philippine peso (PHP) is divided into 100 centavos. The peso has appreciated slightly this year, going from about 45.25 PHP per USD in February 2014 to 44.5 PHP per USD by the end of September, an appreciation of 2.5%. The average bid rate for the first three quarters of 2014 was 44.0168 PHP per USD, while the average ask rate was 44.2871 PHP per USD.
Official Exchange Rate
PHP per USD – 1 year
After the peso suffered a sharp depreciation following the global financial crisis, the Philippine government put in force the Economic Resiliency Plan, increasing government spending and lowering taxes. This led to a period of appreciation of the peso, from November 2008 when the peso was valued at 48.95 PHP per USD to February 2013 when the exchange rate was 40.58 PHP per USD, – an over 20% increase in PHP value. The peso however started depreciating in 2013 and stood at 44.86 PHP per USD in the beginning of 2014.
Official Exchange Rate
PHP per USD – 5 year
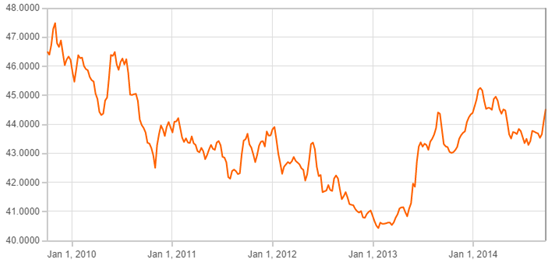
Source: OANDA
![]()
FOREIGN TRADE
Intra- and extra-ASEAN trade in 2013
The Philippines’ total trade in 2013 reached US$119.11 billion, with US$65.13 billion in imports and US$53.98 billion in exports, hence having a trade deficit of US$11.15 billion.
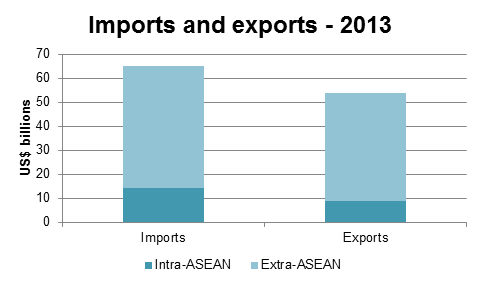
Intra-ASEAN trade reached US$22.79 billion in 2013, accounting for about 19% of Vietnam’s total trade. The share of intra-ASEAN exports of total exports was 16% and the share of intra-ASEAN imports of total imports was 21.8% in 2012.
Philippines’ intra- and extra- ASEAN exports and imports, 2013

Source: ASEAN Secretariat
Trade partners
More than 80% of Philippines exports in 2013 went outside ASEAN, with 21.2% to Japan, 14.5% to the US, 12.2% to China, 11.4% to the EU, 8.2% to Hong Kong and 16.5% to other countries. About 16% of Philippines exports in 2013 were destined for ASEAN countries while about 22% of Philippines’ imports were from ASEAN members. About 13.1% of the country’s imports were from China, 10.9% from the US, 10% from the EU, 8.6% from Japan, 7.9% from Chinese Taipei, and 27.7% from the rest of the world.
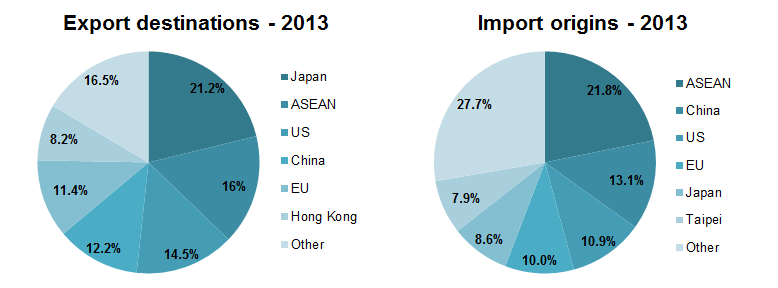
Source: The World Trade Organisation
Commodity groups
A huge part of the Philippines’ trade is with manufactured goods, accounting for 73.4% of total exports and 64.9% of total imports in 2013. About 11.3% of Philippines’ exports are agricultural products, including rice, corn, coconut, and sugar, and about 11% of imports are agricultural products. Fuels and mining products accounted for 23.7% of total imports and 9.8% of total exports in 2013.
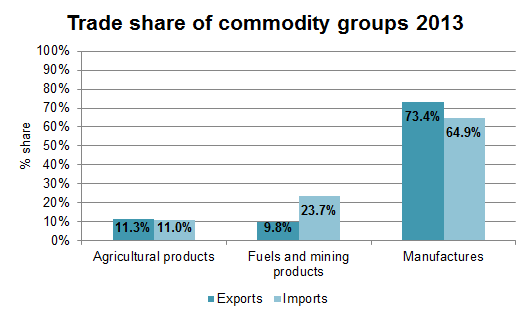
Source: The World Trade Organisation
Intra- and extra-ASEAN trade 2005-2013
The Philippines’ trade with the world plummeted by 20% after the global financial crisis but has now restored to pre-crisis levels and started growing again. The Philippines’ share of intra-ASEAN trade is about 20%, a bit lower than the average intra-ASEAN trade share of 25%, probably due to its strong trading relationship with the US and Japan.
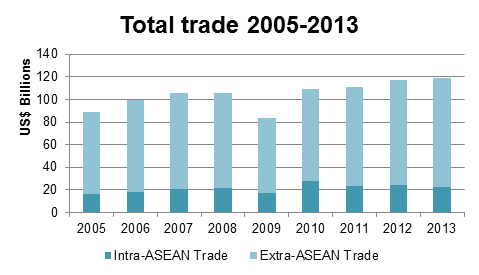
Intra-, extra- and total trade 2005-2013 (US$ billions)

Source: ASEANstats
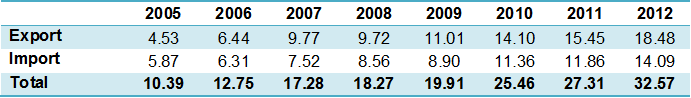
Trade in services 2005-2012
The service industry in the Philippines has seen rapid growth in the recent past, driven partly by business process outsourcing services. According to IBM, in 2010 the Philippines surpassed India as the world leader in BPO services, which generally included call centres, financial service related processes and other processes related to customer support. Philippines’ total trade in services reached US$32.57 billion in 2012, with US$14.09 billion of imported services and US$18.48 of exported services.
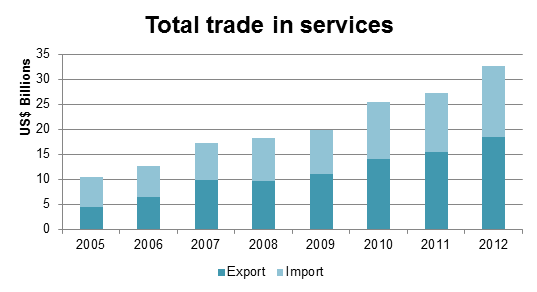
Trade in services 2005-2011 (US$ billions)
Source: ASEAN Statistics

FOREIGN DIRECT INVESTMENT (FDI)
The inflow of foreign direct investment into the Philippines was on a downward trend from 2007 to 2010 but has picked up since then. Total FDI in the Philippines reached US$3.86 billion in 2013; more than triple the 2010 level.

FDI net inflows 2005-2013 (US$ billions)

Source: Worldbank
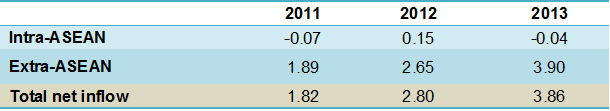
Intra-ASEAN investment in the Philippines is negligible. In 2013, the net inflow was negative by US$40 million, either due to reverse investments or loans from foreign affiliates to parent companies abroad.
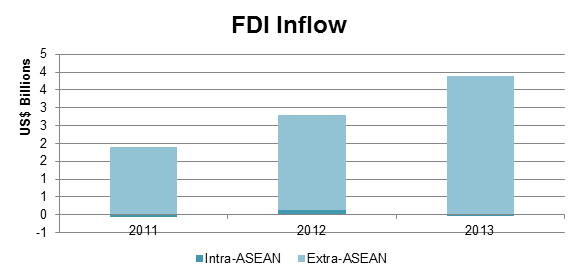
FDI net inflow, intra- and extra-ASEAN, 2011-2013 (US$ millions)
Source: ASEAN Secretariat

- Philippines News
-
- AFGHANISTAN: Higher earning Why a university degree is worth more in some countries than others
- PHILIPPINES: Rebalancing Philippine foreign policy
- PHILIPPINES: Philippines 2016: Rapid Economic Growth to Boost Property Sector
- PHILIPPINES: Will services continue to drive the Philippine economy?
- GREECE: Migration and Women’s Health: A Neglected Issue in Need of Action
- JAPAN: Japans emperor visiting the Philippines, a former WWII site

- Trending Articles
-
- MALAWI: Malawi: Chaponda to Be Backbencher in Malawi Parliament
- NIGERIA: Nigeria: Govt Sacks All Directors in Civil Aviation Authority
- RWANDA: East Africa: Rwanda Targets to Be the Regional Aviation Hub
- CASABLANCA: Morocco Flexed Economic Muscles and Returned to the AU
- NORWAY: Rwanda, Norway Seek Closer Ties
- CHINA: São Tomé and Príncipe and China define areas of cooperation


