


Malaysia: Malaysia Economy Profile
2015/02/16
![]()
BASIC INFORMATION
Capital: Kuala Lumpur
Surface Area: 330,252 sq km
Head of State: The Yang di-Pertuan Agong Tunku Abdul Halim
Head of Government: Prime Minister Dato’ Sri Haji Mohammad Najib bin Tun Haji Abdul Razak
Official Language: Bahasa Melayu
Currency: Malaysian Ringgit (MYR)
Population: 29,720,000 (2013)
![]()
GROSS DOMESTIC PRODUCTION (GDP)
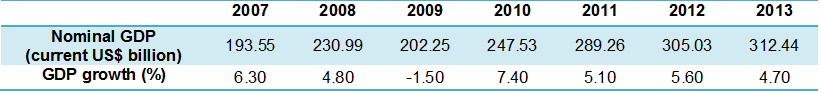
Although greatly affected by the 1997 Asian Financial Crisis, Malaysia grew by a considerable rate of 5.5% from 2000-2008. Economic growth plummeted after the global financial crisis in 2008-2009, leading to an economic contraction of 1.5%, its first GDP contraction since 1997. The country managed to rebound in 2010 with 7.4% growth.
In 2013, economic growth was 4.7%, a bit lower than the 5.6% of the previous year. Nominal GDP reached US$312.44 billion and GDP per capita was US$10,514. The country is on course to become a developed country in 2020 by hitting its targeted US$15,000 per capita.
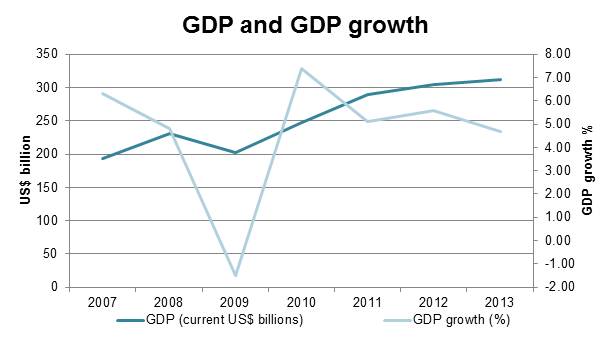
Malaysia’s GDP and GDP growth 2007-2013
Source: World Bank
GDP components
Household consumption accounted for about half of Malaysia’s GDP in 2013, or US$159.25 billion. Government consumption totaled US$42.43 billion which was 14% of GDP, while investment amounted to US$81.7 billion, or 26% of GDP. Malaysia’s external trade balance was positive in 2013 with about US$29 billion, or about 9% of GDP.
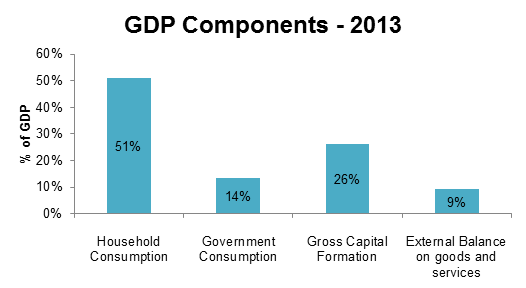
Source: The World Bank
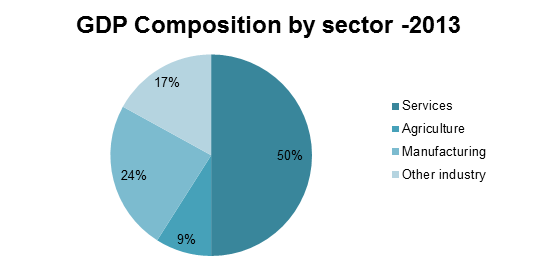
GDP Composition
The services sector contributed exactly half of GDP in 2013, while agriculture, including forestry and fishing accounted for 9%. Manufacturing accounted for 24% of GDP and other industries, including mining, construction, electricity, water and gas, accounted for 17% of GDP.
Source: The World Bank
![]()
CURRENCY
Malaysia’s currency is the Ringgit (MYR), which is divided into 100 cents (sen). The exchange rate has been relatively stable in the past year with the highest and lowest values within a 5% band. The average bid rate for the first three quarters of 2014 was 3.213 MYR per USD, and the average ask rate was 3.2148 MYR per US dollar.
Official Exchange Rate
MYR per USD – 1 year
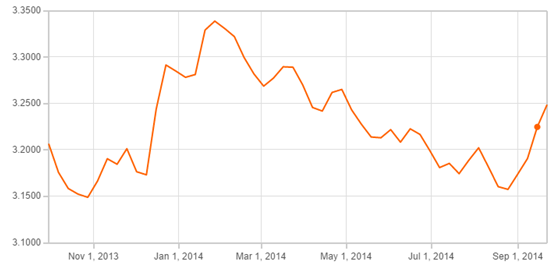
Malaysia saw the ringgit strengthen against the US Dollar during 2010 to mid-2011 due to several factors: low interest rate in the US, rapid economic recovery across emerging markets, strong trade balance, and increasing investment. The ringgit depreciated from early 2013 to the start of 2014 but has started appreciating again, although at a slower rate.
Official Exchange Rate
MYR per USD – 5 year
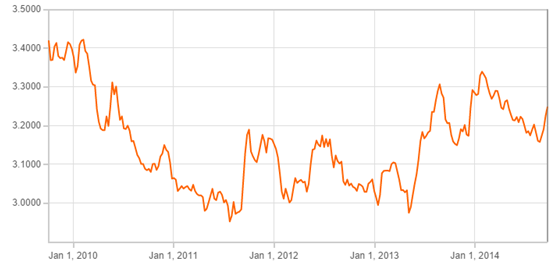
Source: OANDA
TRADE
Intra- and extra-ASEAN trade in 2013
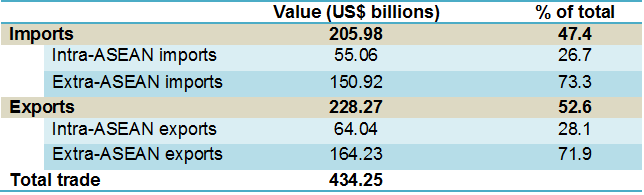
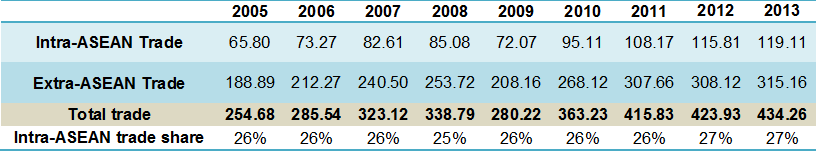
Malaysia’s total trade amounted to US$434.25 billion in 2013, of which exports were US$228.27 billion and imports were US$205.98 billion. Intra-ASEAN trade reached US$119.1 billion, or 27.4% of total trade. The share of intra-ASEAN imports of total imports was 26.7% and the share of intra-ASEAN exports of total exports was 28.1%.
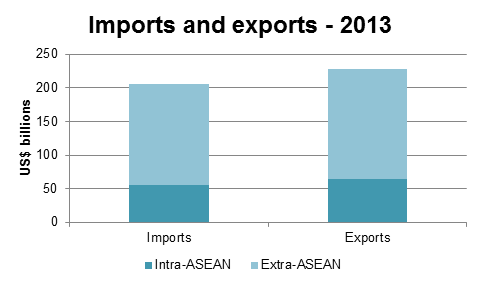
Malaysia’s intra- and extra- ASEAN exports and imports, 2013
Source: ASEAN Secretariat
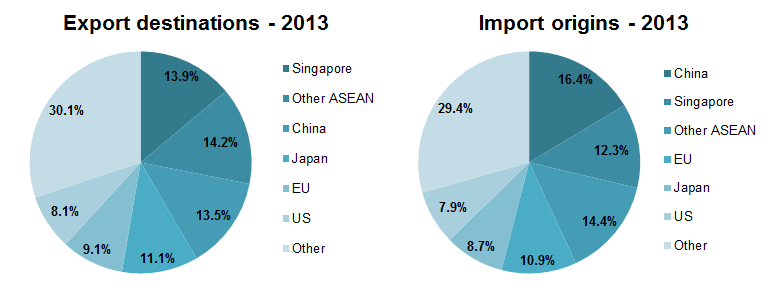
Trade partners
Malaysia’s largest trading partners are Singapore, China, ASEAN, Japan, the EU and the US, and these six trading partners account for over two thirds of Malaysia’s trade. Singapore, Malaysia’s largest export destination, received almost 14% of the country’s exports in 2013, while the rest of ASEAN received 14.2% and China 13.5%. Japan imported 11.1% of Malaysia’s total exports in 2013, while 9.1% and 8.1% went to the EU and the US, respectively. About 30% of Malaysia’s exports in 2013 went to the rest of the world.
ASEAN is also Malaysia’s largest source of imports as about 26.7% of the country’s imports come from the region, of which 12.3% are from Singapore and 14.4% from other ASEAN countries. More than 16% of Malaysia’s imports in 2013 came from China, almost 11% from the EU, 8.7% from Japan, and 7.9% from the US. Nearly 30% of Malaysia’s imports in 2013 came from the rest of the world.
Source: The World Trade Organisation
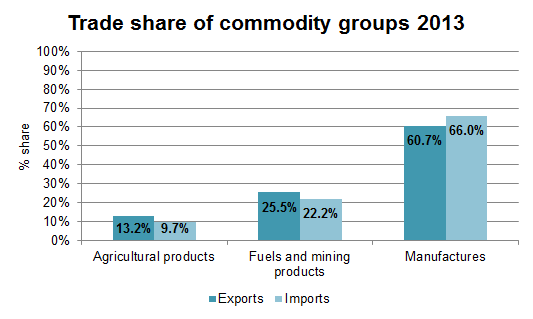
Commodity groups
Manufactures are Malaysia’s largest traded good, with about 60.7% of total exports and 66% of total imports in 2013. A large part of this manufacture is electrical and electronic products. As the country is abundant in natural gas and crude petroleum, the fuels and mining sector contributed a total of 25.5% to total exports in 2013. Malaysia is increasingly importing petroleum products, especially gasoline. About 22% of the country’s imports in 2013 were fuels and mining products, meaning Malaysia remained a net oil exporter despite the narrowing gap between production and consumption of fuels and mining products. About 13.2% of Malaysia’s exports were agricultural products, mainly rubber and palm oil, while almost 10% of the country’s imports were agricultural products.
Source: The World Trade Organisation
Intra- and extra-ASEAN trade 2005-2013
Malaysia’s trade has grown steadily over the past few years, with the 2013 level about 70% higher than the 2005 level. Trade took a big hit in 2009 following the global financial crisis, with contraction of both intra- and extra-ASEAN trade. The share of intra-ASEAN trade has remained fairly constant at 26-27% over the period 2005-2013.
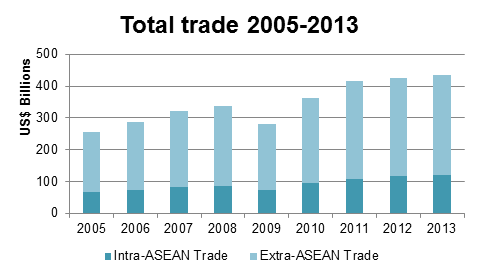
Intra-, extra- and total trade 2005-2013 (US$ billions)
Source: ASEANstats
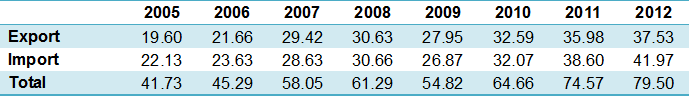
Trade in services 2005-2012
Malaysia’s total trade in services reached US$79.5 billion in 2012, with US$37.53 billion in exported services and US$41.97 billion in imported services.
The travel sector has been contributing more than 50% to the total service export since 2008. Transportation service, including both sea and air transportation, have seen its export value decreased from US$6.8 billion in 2008 to US$4.4 billion in 2012, while importation of transportation services increased from US$11.4 billion in 2008 to US$13.5 billion in 2012.
In terms of service import, the travel sector has been on the rise, reaching US$11.5 billion in 2012, compared to US$6.7 billion in 2008, thanks to the affordability of air fares as well as the rising income levels.
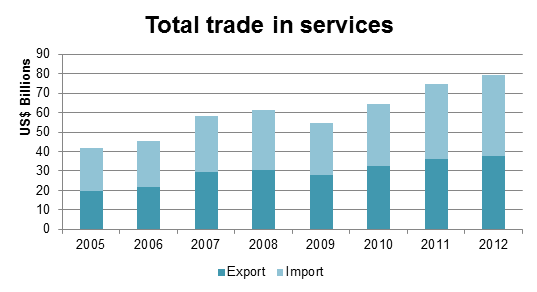
Trade in services 2005-2012 (US$ billions)
Source: ASEAN Statistics
FOREIGN DIRECT INVESTMENT (FDI)
The inflow of foreign investment in Malaysia reached US$11.58 billion in 2013, higher than in 2012 when FDI was US$9.73 billion but lower than the record high level of US$15.12 billion reached in 2011. Malaysia had dismal FDI in 2009, only US$110 million, due to the global financial crisis.
Malaysia has become a popular spot for foreign investors because of the high return of foreign investments. Based on the Investment Report 2013 prepared by United Nations Conference on Trade and Development (UNCTAD), Malaysia was ranked the 11th country among top 20 countries with highest inward FDI rates of return. In 2011, the country achieved 17% IRR for its FDI funds. 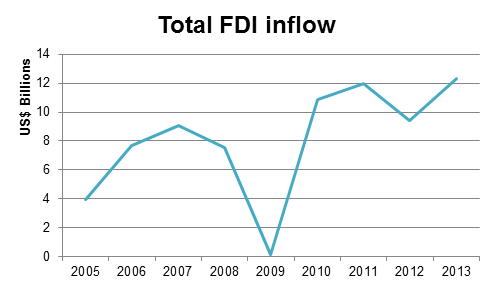
FDI net inflows 2005-2013 (US$ millions)

Source: Worldbank
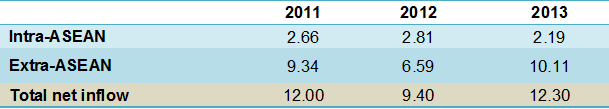
The largest part of Malaysia’s FDI inflows is from outside of ASEAN. In 2013, extra-ASEAN investments accounted for US$10.11 billion while intra-ASEAN investments accounted for US$2.19 billion.
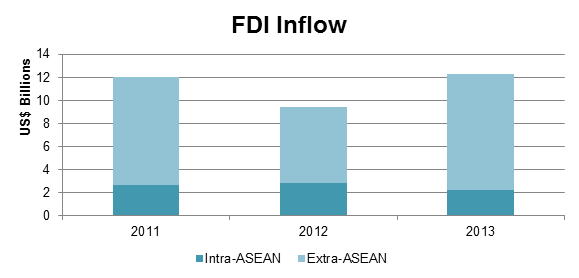
FDI net inflow, intra- and extra-ASEAN, 2011-2013 (US$ billions)
Source: ASEAN Secretariat

- Malaysia News
-
- MALAYSIA: Why Malaysian Universities Are Performing Poorly
- MALAYSIA: Malaysia's GDP Growth Moderates In Q4
- MALAYSIA: Malaysia Exports contraction moderates in November,
- MALAYSIA: The pilot questioned why the plane leaving from Auckland airport was not taking a more direct route to Kuala Lumpur
- AFGHANISTAN: Global growth will be disappointing in 2016: IMF's Lagarde
- MALAYSIA: Malaysian company secures credit line for project in Angola

- Trending Articles
-
- WORLD: Tech Guru Overtakes Warren Buffett On World's Richest List
- TURKEY: Failed Turkey Coup May Signal Beginning of the End for NATO, European Union
- IRAN: Iranian, French carmakers enter joint venture deal
- CHINA: Tanzania Companies Look Forward to Chinese Trade Expo
- OMAN: A total of 500 jobs will be created ,project in the Wilayat of Sur
- TANZANIA: Dr Juliana Pallangyo, the deputy permanent secretary in the ministry of energy and minerals,

.gif?1356023993 "Business Park of Mauritius Ltd, Mauritius")


