


Laos: Laos Economy Profile
2015/02/16

![]()
BASIC INFORMATION
Capital: Vientiane
Surface Area: 3,920 sq km
Head of State: President Choummaly Sayasone
Head of Government: Prime Minister Thongsing Thammavong
Official Language: Lao language
Currency: Lao Kip (LAK)
Population: 6,770,000 (2013)
Gross Domestic Production (GDP)
Laos’s nominal GDP in 2013 was US$11.14 billion, more than twofold the 2008 level. Economic growth was 8.1% in 2013 and GDP per capita was US$1,646 in 2013, one of the lowest in ASEAN. Economic growth has been strong over the past few years due to strong exports and large infrastructure projects and in 2011 Laos reached the status of a ‘lower-middle income economy’. Due to economic isolation, Laos wasn’t hard hit during the global financial crisis as economic growth of 7.5% in 2007.
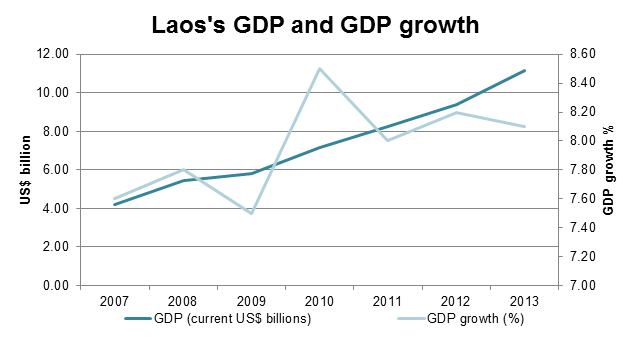
Laos GDP and GDP growth 2007-2013
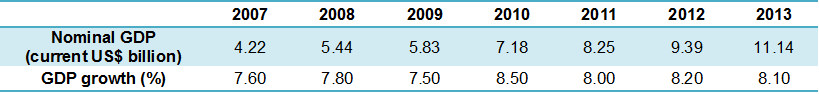
Source: World Bank
GDP components
Household consumption accounted for about 69% of Cambodia’s GDP in 2012, or US$6.46 billion. Government consumption totaled US$1.08 billion which was 11% of GDP, while investment amounted to US$29.91 billion and accounted for 32% of GDP. Laos’s trade balance was negative by US$1.15 billion.
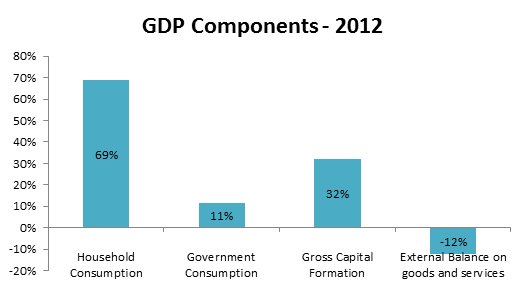
Source: The World Bank
GDP Composition
The services sector has been growing fast over the past few years and is now the country’s largest sector, accounting for about 36% of GDP in 2012. About 28% of GDP in 2012 came from the agricultural sector, as Laos is still to a large part an agricultural society. Industry – including mining, construction, electricity, water, and gas – composed 28% of Laos’s GDP, while the manufacturing industry accounted for about 8% of GDP.

Source: The World Bank
CURRENCY
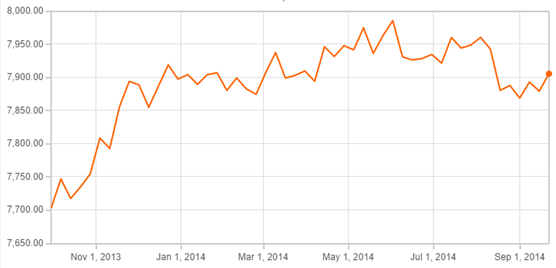
The currency of Laos is Lao KIP (LAK) and one kip is divided into 100 att. The kip has depreciated slightly over the past year, going from 7,700 kip per US dollar in September 2013 to over 7,900 by September 2014. The average bid rate for the first three quarters of 2014 was 7887.6 LAK per USD and the average ask rate was 8215.3.
Official Exchange Rate
LAK per USD – 1 year
The Lao Kip has strengthened significantly against the US Dollar since 2010 when the exchange rate was about 8,350 LAK per USD. The kip’s strongest exchange rate was in early 2013 when it reached about 7560 kip per US dollar, but has now balanced at around 7880 kip per dollar. The appreciation can be attributed to the inflows of foreign currency associated with foreign investments and increasing export.
Official Exchange Rate
LAK per USD – 5 year
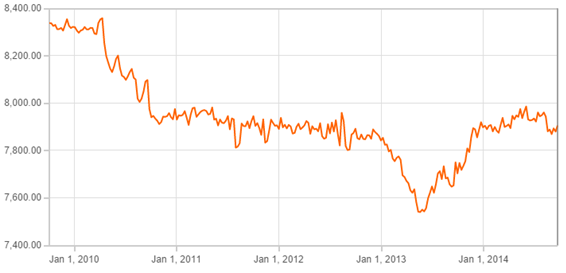
Source: OANDA
TRADE
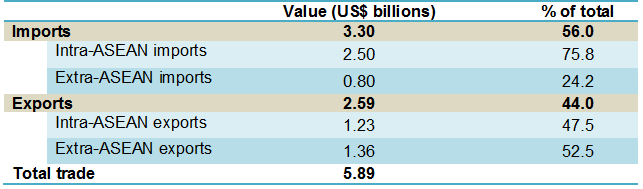
Intra- and extra-ASEAN trade in 2013
Laos’s trade with the world reached a total of US$5.89 billion in 2013, with US$3.3 billion in imports and US$2.59 billion in exports, meaning Laos had a trade deficit of US$710 million that year. Intra-ASEAN trade reached US$3.73 billion in 2013, accounting for 63.3% of Laos’s total trade. The share of intra-ASEAN exports of total exports was 75.8% and the share of intra-ASEAN imports of total imports was 47.5% in 2013.
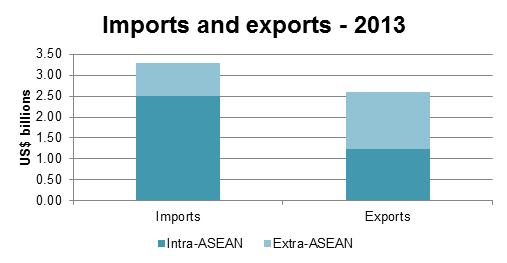
Laos’ intra- and extra- ASEAN exports and imports, 2013
Laos’s imports mainly fuel, vehicles, construction equipment, raw materials for industrial production, food and other supplies. Laos’ fuel and gas is imported from Thailand, construction materials imported from Vietnam and products for industry imported from China. Laos’s main export market in 2013 was Thailand, China, Vietnam, Japan and China with minerals, electricity, manufactures, and agricultural products the main exported goods.
Source: ASEAN Secretariat
Intra- and extra-ASEAN trade 2005-2013
Laos started to significantly increase its trade with the world in the year 2008, first mostly with ASEAN members but increasingly also with other parts of the world. Extra-ASEAN trade was exceptionally high in 2012 when it reached US$3.82 billion, making the intra-ASEAN trade share that year only 38%, low compared with its usual share of over 60%.
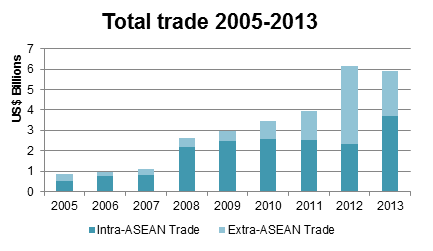
Intra-, extra- and total trade 2005-2013 (US$ billions)

Source: ASEANstats
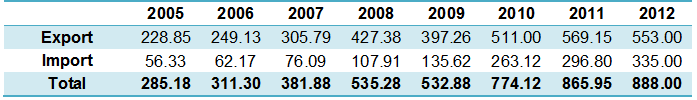
Trade in services 2005-2012
Laos’s trade in services in 2012 reached US$888 million, with US$553 million exported services and US$335 million imported services. As the case with other trade, trade in services has increased notably over the past three years. The 2012 level of trade in services was about 66% higher than the 2009 level.
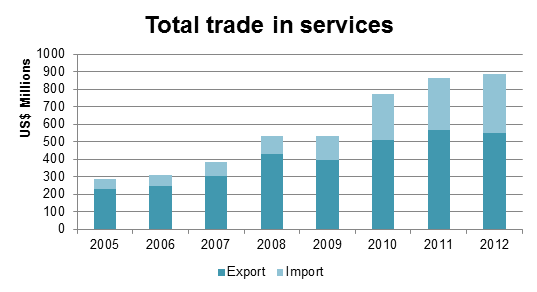
Trade in services 2005-2011 (US$ millions)
Source: ASEAN Statistics

FOREIGN DIRECT INVESTMENT (FDI)
Laos has been attracting more and more foreign investments over the past few years. FDI inflows sharply rose from US$27.7 million in 2005 to US$323.5 million in 2007. Yearly investment since then has been around US$300 million. Laos’ investment comes majorly from outside of ASEAN countries such as China and Korea.

FDI net inflows 2005-2013 (US$ millions)

Source: Worldbank
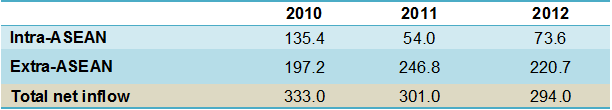
The largest part of Laos’s FDI inflows is from countries outside of ASEAN. In 2012, extra-ASEAN investments accounted for US$220.7 million while intra-ASEAN investments accounted for US$73.6 million.

FDI net inflow, intra- and extra-ASEAN, 2011-2013 (US$ millions)
Source: ASEAN Secretariat

- Laos News
-
- AFGHANISTAN: UNWTO: International tourism – strongest half-year results since 2010
- CHINA: Laos speeds up railway construction machinery import from China
- AFGHANISTAN: Higher earning Why a university degree is worth more in some countries than others
- AFGHANISTAN: Global growth will be disappointing in 2016: IMF's Lagarde
- BRUNEI : The AEC regime would integrate all ten country members of Southeast Asian politics and economy
- LAOS: Savannakhet Province as Trade and Services Center

- Trending Articles
-
- SOUTH AFRICA: Nigeria and South Africa emerge from recession
- UZBEKISTAN: Former deputy PM named Uzbekistan Airways head
- BAHRAIN: Bahrain issues new rules to encourage fintech growth
- ARUBA: Director of Tourism Turks and Caicos after Irma: Tourism, visitors, hotels current status
- AUSTRALIA: Western Australia joins two-thirds of country to ban fracking
- ANGOLA: Angola: Elections / 2017 - Provisional Data Point Out Qualified Majority for MPLA


