


Myanmar: Myanmar Economy Profile
2015/02/16
BASIC INFORMATION
Capital: Naypyidaw
Surface Area: 676,578 sq km
Head of State and Government: President U Thein Sein
Official Language: Myanmar language
Currency: Myanmar kyat (MMK)
Population: 52.8 million (2012 estimate)
Gross Domestic Production (GDP)
The Myanmar economy has started to enjoy the fruits of its political and economic reforms, which started in 2011. GDP in 2013 is estimated to have reached US$56.4 billion, and this year the GDP is forecasted to reach US$60.3 billion. Economic growth has increased significantly from the years 2009-2011, which saw an average of 5.5% growth, to 2012 when Myanmar’s economy is expected to have grown by 7.3%, and in 2013 the estimated growth is 7.5%.
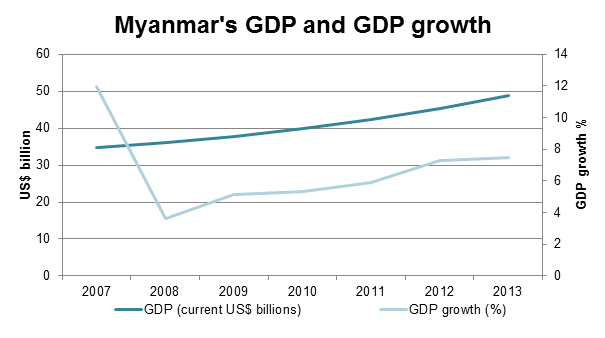
Myanmar’s GDP 2007-2013
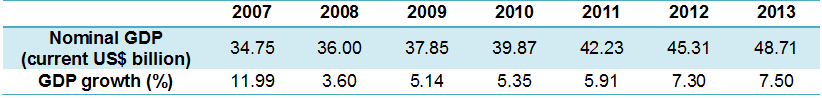
Source: World Bank
CURRENCY
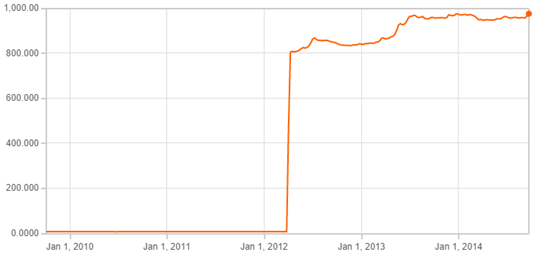
The currency of Myanmar is called the kyat and has the ISO code of MMK. The kyat has had a floating exchange rate since April 2012, when the initial rate was set at 818 kyat per US dollar. Before 2012, the Myanmar government had a fixed exchange rate regime, and the official exchange rate was about 5-6 kyats per US dollar. During this period, the black market exchange rate reflected the real value of the kyat more accurately with street rates at about 800-1000 kyat per US dollar. Following a period of depreciation since the floating of the kyat, the currency has been quite stable since late mid-year 2013. In the first three quarters of 2014, the kyat has had an average bid rate of about 963 kyat per US dollar and an average ask rate at 997 kyat per US dollar.
Official Exchange Rate
MMK per USD – 1 year
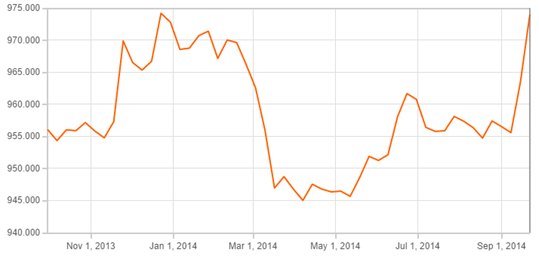
Official Exchange Rate
MMK per USD – 5 year
Source: OANDA
TRADE
Intra- and extra-ASEAN trade in 2013
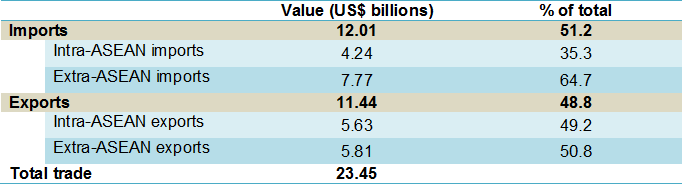
Myanmar’s total trade in 2013 was US$23.45 billion. Myanmar’s total exports were US$11.44 billion and total imports were US$12.01 billion, meaning Myanmar had a trade deficit of about US$570 million. Myanmar’s trade volume is miniscule compared with many of its ASEAN neighbours – slightly less than 1% of the total ASEAN trade in 2013 of about US$2.51 trillion.
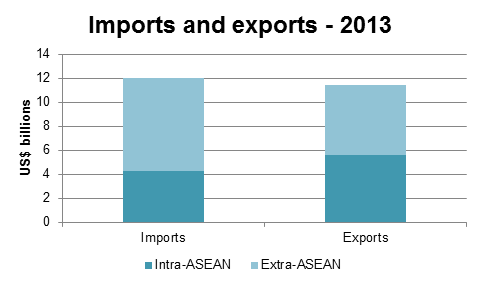
Intra-ASEAN trade reached US$9.87 billion in 2013, accounting for 42% of Myanmar’s trade with the world in 2012. The share of intra-ASEAN exports of total exports was 49.2% and the share of intra-ASEAN import of total imports was 35.3%.
Myanmar’s intra- and extra- ASEAN exports and imports, 2013
Source: ASEAN Secretariat
Trade partners
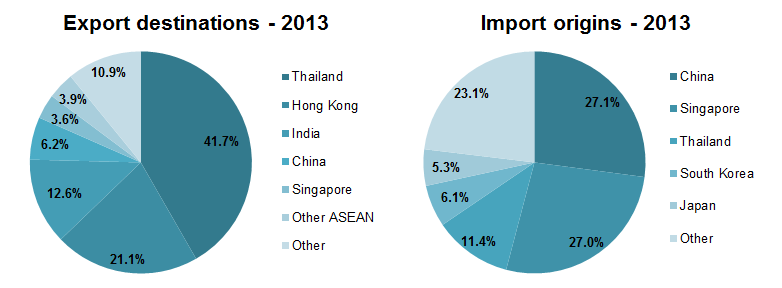
In 2013, Thailand was by far the largest destination for Myanmar exports, receiving 41.7% of all Myanmar exports. The second largest export destination was Hong Kong (21.1%), India (12.6%), and China (6.2%). Singapore received 3.6% of Myanmar’s total exports in 2013 while the rest of ASEAN received 3.9%. Most of Myanmar’s imports come from China (27.1%) and Singapore (27%). Thailand is the third main import origin with 11.4%, followed by South Korea (6.1%) and Japan (5.3%). About 23% of Myanmar’s imports in 2013 came from the rest of the world.
Source: The World Trade Organisation
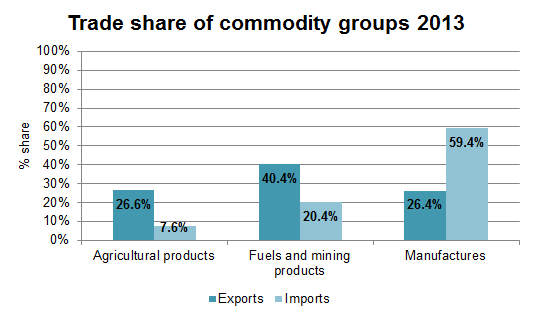
Commodity groups
Manufactured goods are Myanmar’s largest imported commodity, accounting for almost 60% of total imports in 2013. Fuels and mining products accounted for 20.4% of imports in 2013 and agricultural products 7.6%. The largest share of Myanmar’s exports are fuels and mining products (40.4%), followed by agricultural products (26.6%) and manufactured goods (26.4%).
Source: The World Trade Organisation
Intra- and extra-ASEAN trade 2005-2013
Myanmar’s total trade levels have increased substantially over the past few years, almost doubling in size from the 2010 level of US$11.80 billion to US$23.45 billion in 2013. Extra-ASEAN trade has grown faster than intra-ASEAN trade, unsurprisingly since before 2011 Myanmar was largely cut off to the world. The share of intra-ASEAN trade of total trade has fallen from 52% in 2009 to 42% in 2013.

Myanmar’s intra-, extra- and total trade 2005-2013 (US$ billions

Source: ASEANstats
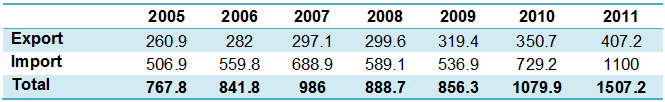
Trade in Services
Myanmar’s trade in services is relatively small compared with other ASEAN members. Myanmar’s total traded services in 2011 reached only US$1.5 billion, while Vietnam traded over US$20 billion in services that same year. Myanmar has however been increasing its trade in services in recent years, especially the import of services, which reached a level of US$1.1 billion in 2011. Myanmar’s export of services totalled at US$407 million in 2011.
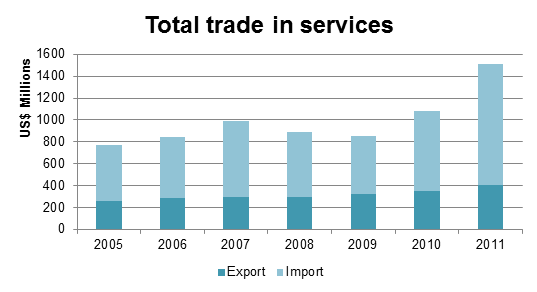
Trade in services 2005-2011 (US$ millions)
Source: ASEAN Statistics

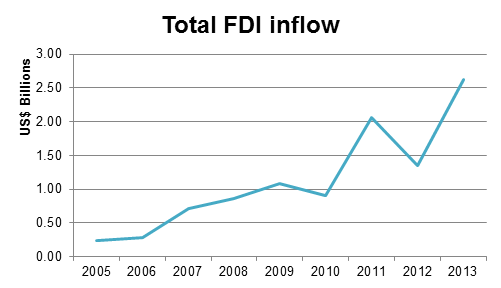
FOREIGN DIRECT INVESTMENT (FDI)
The level of foreign direct investment has risen sharply in Myanmar since the country started a series of political and economic reforms. Total net inflow of FDI in 2013 was US$2.62 billion, almost double the 2012 amount of US$1.35 billion. FDI in Myanmar was also exceptionally high in 2011, reaching US$2.06 billion, explained by China’s large scale investment in natural gas development and pipelines.
FDI net inflows 2005-2013 (US$ billions)

Source: Worldbank
Intra-ASEAN FDI in Myanmar increased significantly in 2013, reaching US$1.19 billion and accounting for 45% of total FDI. In the years 2011 and 2012, intra-ASEAN FDI had been miniscule, only US$80 million and US$150 million respectively.
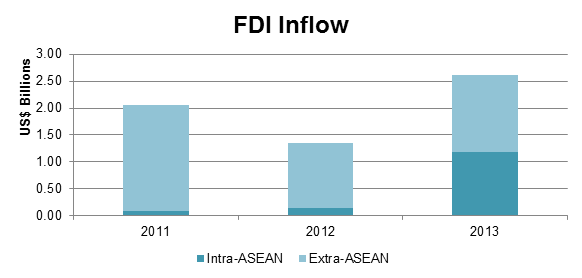
FDI net inflow, intra- and extra-ASEAN, 2011-2013 (US$ billions)
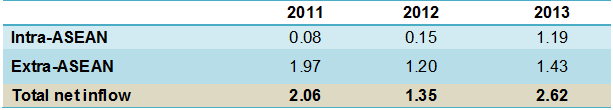
Source: ASEAN Secretariat

- Myanmar News
-
- AFGHANISTAN: UNWTO: International tourism – strongest half-year results since 2010
- MYANMAR: Myanmar steps up reforms to entice investors
- MYANMAR: Myanmar expands electricity access through small grids
- CHINA: Myanmar President arrives in China for visit
- MYANMAR: Rakhine airport in Myanmar to be built by tender
- AFGHANISTAN: Higher earning Why a university degree is worth more in some countries than others

- Trending Articles
-
- BOTSWANA: Africa: U.S. State Department To Get Experienced Diplomat in Key Africa Post
- BURUNDI: Burundi: Govt Rejects UN Accusations of Crimes Against Humanity
- CHINA: China Invites 5 Countries As Guests For BRICS Summit
- IRAN: Saudi Arabia denies warming relations with Iran
- ISRAEL: Finance Ministry: Housing market slower in July
- QATAR: Blockaded Qatar's economy troubled, but coping


